Covid 19 France - Departmental Update
Friday 04 September 2020
France recorded a significant increase in Covid-19 infection rates over the August holiday period, and it now remains to be seen how the return to work and school will impact.
POSTSCRIPT: See latest figures in our October 2020 article Covid-19 Alert Levels Increase.
Last week, the French government published the latest results of Covid-19 testing activity for the week ending 27th August.
During the week 688,000 individuals were tested in mainland France, of whom 25,410 tested positive. The increase in the number testing positive (+58%) was greater than the number of tests carried out (+32%).
The end of month figure compares with 526,000 individuals tested at the beginning of August, of whom 7,565 tested positive.
Around 40% of the new cases are in the age group 15/45 years, of whom around 80% were asymptomatic.
As a result, the number of hospitalisations and deaths remains comparatively low, although with around 20 deaths occurring over a 24-hour period it remains a significant statistic. The number of patients in intensive care has also risen by around 80 over a week, although it remains under 500, and the rate of occupation of intensive care beds is low, around 7%, ranging from 0.8% in Normandy to 16% in Paris.
The rate of infection is, however, on the rise, with 39.2 cases/100,000 inhabitants, against 11.6/100,000 at the beginning of the month; the same trend was observed for the percentage testing positive; 3.7% against 1.5% at the beginning of August.
The number testing positive has since increased to 4.4% as of 3rd Sept and infection rates are now running at around 7,000 per day.
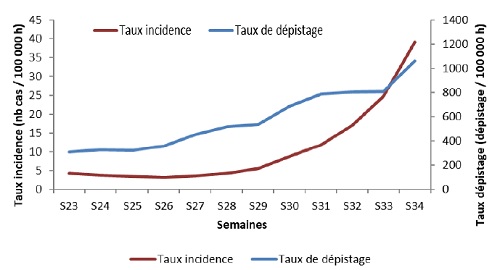
The following graphic shows the rate of infection (taux incidence) and the rate of testing (taux de dépistage) to week ending 27th August, which shows the infection rate is increasing faster than the rate of testing.
Nevertheless, some caution is needed in the interpretation of the rise in the infection rate, which is affected by the focused activity on tracing and testing, as the public health authority of the government themselves point out:
'The number of positive tests reported and the infection rate calculated from it are directly influenced by the screening activity, particularly in a cluster context. Departments that have implemented screening activities, particularly in clusters or in communities will therefore tend to have a temporarily higher estimated infection rate due to these screening activities'.
The following table provides a summary of testing activity in each department, with the main results of that testing to 30th August.
Many departments now have an infection rate higher than 10/100,000 inhabitants, a threshold which triggers more action by the authorities.
Indeed, 15 departments had rates higher than 50/100,000 inhabitants, although that includes all 8 departments in the Ile-de-France.
The highest infection rate was observed in the Bouches-du-Rhône (176/100,000), followed by Paris (145/100,000), Val-et-Marne (126/100,000), Alpes Maritimes (124/100,000), Gironde (121/100,00) and Hauts-de-Siene (105/100,000). As a result, these departments have the largest screening rates, circa 2,000 per 100,000 inhabitants.
The rate of positivity was highest in Val-de-Marne (8.4%), Paris (7.2%), Seine-Saint-Denis (7.2%), Bouches-du-Rhône (7.1%), Gironde (6.5%) and Rhône (6.3%). Hérault and Alpes-Maritimes also reached 5.9%.
More encouragingly, in many remaining departments rates remain low and even these departmental figures cannot show how localised are the outbreaks, which may be occurring in a small number of communes within each department.
It should also be noted, particularly over this holiday period, that cases are recorded by the place of permanent residence, not by holiday destination.
It is noteworthy from the table how, with suitable measures put in place, infection rates can be reduced. Thus, at the beginning of the month, the department of Mayenne recorded the highest infection rate in France of 148.7/100,000, with 3.5% patients testing positive. The latest figures show the infection rate has now fallen to 20/100,000, with 1.5% of these tested testing positive.
| Covid-19 - Testing | ||||
| Region/Dept | Number of Persons Tested | Percentage Testing Positive | Infection Rate Per 100,000 | |
| AUVERGNE-RHONE-ALPES | ||||
| Ain | 6,192 | 4.8% | 45.2 | |
| Allier | 3,448 | 1.7% | 17.2 | |
| Ardèche | 2,685 | 2.8% | 23.3 | |
| Cantal | 1,198 | 0.8% | 6.3 | |
| Drôme | 4,823 | 3.8% | 35.7 | |
| Isère | 10,195 | 4.3% | 35.1 | |
| Haute-Loire | 1,940 | 2.4% | 20.7 | |
| Loire | 7,810 | 3.9% | 39.9 | |
| Puy-de-Dôme | 7,131 | 3.3% | 36.0 | |
| Rhône | 26,266 | 6.3% | 88.4 | |
| Haute-Savoie | 6,989 | 3.7% | 30.5 | |
| Savoie | 3,528 | 3.6% | 29.4 | |
| BRITTANY | ||||
| Côte d'Amour | 6,095 | 1.3% | 13.4 | |
| Finistère | 8,600 | 1.7% | 15.9 | |
| IIe-et-Vilaine | 13,456 | 2.7% | 33.2 | |
| Morbihan | 6,689 | 2.0% | 17.6 | |
| BOURGOGNE FRANCHE-COMTE | ||||
| Belfort | 1,669 | 1.9% | 22.8 | |
| Côte-d'Or | 10,050 | 3.5% | 66.2 | |
| Doubs | 6,667 | 2.4% | 29.7 | |
| Haute-Saône | 2,540 | 1.2% | 12.0 | |
| Jura | 2,506 | 1.8% | 17.8 | |
| Nièvre | 1,795 | 2.2% | 19.5 | |
| Saône-et-Loire | 4,506 | 2.4% | 18.6 | |
| Yonne | 3,783 | 2.7% | 31.3 | |
| CENTRE-VAL DE LOIRE | ||||
| Cher | 2,765 | 1.6% | 15.2 | |
| Eure-et-Loir | 4,682 | 2.3% | 25.1 | |
| Indre | 1,369 | 2.5% | 21.6 | |
| Indre-et-Loire | 7,216 | 2.2% | 26.1 | |
| Loir-et-Cher | 2,878 | 2.3% | 20.1 | |
| Loiret | 10,080 | 3.7% | 55.4 | |
| GRAND EST | ||||
| Ardennes | 2,687 | 1.2% | 12.4 | |
| Aube | 3,526 | 1.9% | 21.9 | |
| Haute-Marne | 1,595 | 1.6% | 16.0 | |
| Marne | 6,634 | 2.3% | 27.0 | |
| Meurthe-et-Moselle | 8,515 | 2.7% | 31.4 | |
| Meuse | 2,188 | 1.4% | 17.1 | |
| Moselle | 14,975 | 2.3% | 32.6 | |
| Bas-Rhin | 16,678 | 2.6% | 38.0 | |
| Haut-Rhin | 8,208 | 1.9% | 20.3 | |
| Vosges | 3,222 | 1.7% | 15.0 | |
| HAUTS DE FRANCE | ||||
| Aisne | 2,922 | 3.1% | 17.5 | |
| Nord | 32,681 | 3.0% | 37.5 | |
| Oise | 5,611 | 3.5% | 24.5 | |
| Pas-de-Calais | 13,120 | 2.2% | 19.5 | |
| Somme | 3,774 | 2.0% | 13.3 | |
| ILE-DE-FRANCE | ||||
| Paris | 43,092 | 7.2% | 145.2 | |
| Seine-Saint-Denis | 21,598 | 7.2% | 93.0 | |
| Hauts-de-Seine | 27,234 | 6.2% | 105.8 | |
| Val-et-Marne | 21,098 | 8.4% | 126.4 | |
| Val d'Oise | 14,833 | 5.8% | 69.5 | |
| Yvelines | 15,574 | 5.4% | 58.5 | |
| Essonne | 15,155 | 5.4% | 62.0 | |
| Seine-et-Marne | 14,977 | 5.5% | 57.7 | |
| NOUVELLE-AQUITAINE | ||||
| Charente | 3,727 | 1.2% | 12.6 | |
| Charente-Maritime | 4,498 | 1.5% | 10.5 | |
| Corrèze | 2,415 | 1.4% | 13.7 | |
| Creuse | 1,556 | 0.6% | 8.6 | |
| Deux-Sèvres | 3,886 | 2.0% | 20.9 | |
| Dordogne | 4,842 | 1.9% | 22.8 | |
| Gironde | 30,451 | 6.5% | 121.8 | |
| Landes | 4,319 | 2.2% | 22.6 | |
| Lot-et-Garonne | 2,587 | 3.6% | 28.5 | |
| Pyrénées-Atlantiques | 11,367 | 2.4% | 39.7 | |
| Haute-Vienne | 3,396 | 2.7% | 24.5 | |
| Vienne | 4,017 | 2.6% | 24.2 | |
| OCCITANIE | ||||
| Ariège | 1,755 | 2.2% | 24.9 | |
| Aude | 4,380 | 2.3% | 26.8 | |
| Aveyron | 3,441 | 2.3% | 27.7 | |
| Gard | 7,231 | 4.8% | 46.0 | |
| Gers | 1,758 | 3.6% | 33.2 | |
| Haute-Garonne | 21,360 | 3.5% | 53.8 | |
| Hautes-Pyrénées | 2,524 | 1.7% | 19.4 | |
| Hérault | 16,475 | 5.9% | 83.3 | |
| Lot | 1,578 | 1.0% | 9.2 | |
| Lozère | 647 | 1.9 | 15.7 | |
| Pyrénées-Orientales | 5,031 | 2.8% | 29.0 | |
| Tarn | 5,016 | 2.7% | 35.6 | |
| Tarn-et-Garonne | 3,899 | 2.8% | 41.5 | |
| NORMANDY | ||||
| Calvados | 8,540 | 1.6% | 18.7 | |
| Manche | 3,605 | 1.8% | 13.9 | |
| Orne | 2,416 | 1.2% | 10.8 | |
| Eure | 4,076 | 3.8% | 24.5 | |
| Seine-Maritime | 12,330 | 4.9% | 48.4 | |
| PAYS DE LA LOIRE | ||||
| Loire-Atlantique | 14,365 | 3.0% | 30.3 | |
| Maine-et-Loire | 7,162 | 2.8% | 24.9 | |
| Mayenne | 4,170 | 1.5% | 20.0 | |
| Sarthe | 10,122 | 2.6% | 46.8 | |
| Vendée | 6,297 | 1.0% | 9.2 | |
| PROVENCE-ALPES-COTE D'AZUR | ||||
| Alpes-de-Haute-Provence | 1,754 | 3.7% | 41.8 | |
| Alpes-Maritimes | 22,761 | 5.9% | 124.2 | |
| Bouches-du-Rhône | 50,623 | 7.1% | 176.6 | |
| Hautes-Alpes | 1,036 | 3.1% | 22.6 | |
| Var | 16,794 | 4.1% | 64.2 | |
| Vaucluse | 6,176 | 5.0% | 54.7 | |
Thank you for showing an interest in our News section.
Our News section is no longer being published although our catalogue of articles remains in place.
If you found our News useful, please have a look at France Insider, our subscription based News service with in-depth analysis, or our authoritative Guides to France.
If you require advice and assistance with the purchase of French property and moving to France, then take a look at the France Insider Property Clinic.