House Prices in France 2019
Tuesday 05 May 2020
The notaires have recently published their figures for the movement in house prices for 2019, for each department of France.
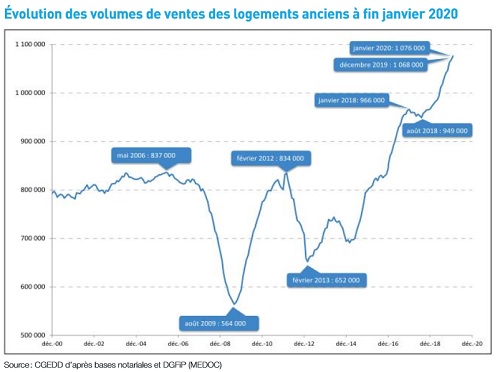
In the year, the volume of transactions (houses and apartments, excluding new build) continued apace, increasing by 11% over 2018, to reach 1,076,000.
The government statistical office state that: 'Transactions remain at a level never before achieved, even taking into account the increase in the housing stock (about 1% per year): in relation to the housing stock, the number of transactions is greater than or equal to the highest level of sales observed in the early 2000s.'
Most commentators consider that the historically low level of mortgage interest rates (around 1.2%) has been the main factor behind the increase, prompting many investors seeking to build a rental portfolio to pile into the market.
The graphic below shows the level of sales since 2000. No geographic breakdown of sales is available.
In terms of prices, the notaires state that house prices outside of the Ile-de-France rose by an average of 3.1% over the year, following an increase of 2.9% in 2018. Apartment prices rose by 4.9%. Within the Ile-de-France apartment prices rose by an average of 5.6%, whilst house prices by a more meagre 0.4%.
As can be seen from the table below, these averages disguise huge disparities across the country, ranging from +12.5% in Deux Sèvres (Nouvelle Aquitaine) to -12.5% in Nièvre (Burgundy).
However, due to the relatively low number of sales in many departments, such movements in prices need to be treated with caution. A more realistic picture is the 5-year average movement that we also show.
Lowest average house prices in France are in Creuse (Nouvelle Aquitaine) where price fell -6.6% in the year to reach €59,700. Over the last 5 years average prices in the department have fallen by -6.8%.
Highest prices are in Alpes-Maritimes (PACA), where prices fell by -2.7% in the year to €437,100.
The table shows the percentage movement in prices for each department in the year to Dec 2019, the percentage price change for the period 2014-19, and the average house price for each department at the end of Dec 2019.
As we have previously stated with these tables, there is an urban bias to the analysis, as most sales occur within towns and cities, so they do not necessarily reflect what is happening in the much smaller, disparate rural property market.
A recent short review of prices in that market by observers Meilleurs Agents, shows that over the past 10 years prices had fallen on average by -4.4%; over 5 years they had increased by +2.8%, and in 2019 they had increased by +1.9%.
A specific analysis of the market for country properties was also provided in our article Rural House Prices in France 2018. We shall be updating these figures when those for 2019 are published.
Not surprisingly, the notaires and other commentators are forecasting that prices will fall in 2020 due to higher levels of unemployment, a lack of confidence in the future by potential buyers, and tighter restrictions on lending by banks. Sales are also forecast to be down to 700,000 to 800,000 in the year.
| House Prices 2019 | |||
| Region/Dept | % Change 2019 | Average % Change 2014-19 | Average Price 2019 |
| AUVERGNE-RHONE-ALPES | |||
| Ain | +2.6% | +11.2% | €205,000 |
| Allier | +5.9% | +0.2% | €98,200 |
| Ardèche | +3.1% | +12.3% | €163,000 |
| Cantal | -4.7% | +0.1% | €100,100 |
| Drôme | +9.1% | +16.6% | €205,800 |
| Isère | +4.5% | +14.9% | €230,000 |
| Haute-Loire | -2.0% | -0.4% | €116,200 |
| Loire | +5.3% | +6.7% | €160,000 |
| Puy-de-Dôme | +0.9% | +5.3% | €160,000 |
| Rhône | +6.8% | +19.9% | €315,200 |
| Haute-Savoie | +10.2% | +13.6% | €374,600 |
| Savoie | +9.7% | +1.9% | €240,000 |
| BRITTANY | |||
| Côte d'Amour | +6.3% | +16.4% | €135,000 |
| Finistère | +0.3% | +8.4% | €149,000 |
| IIe-et-Vilaine | -4.0% | +7.4% | €177,300 |
| Morbihan | +4.7% | +12.5% | €180,000 |
| BOURGOGNE FRANCHE-COMTE | |||
| Belfort | +2.3% | +16.9% | €163,700 |
| Côte-d'Or | +6.7% | +11.8% | €170,000 |
| Doubs | +8.6% | +9.8% | €186,600 |
| Haute-Saône | -6.3% | -1.2% | €107,700 |
| Jura | +1.0% | +9.8% | €136,100 |
| Nièvre | -12.5% | -8.2% | €70,000 |
| Saône-et-Loire | -1.6% | +1.9% | €117,200 |
| Yonne | -7.6% | -1.9% | €103,000 |
| CENTRE-VAL DE LOIRE | |||
| Cher | +3.2% | +6.5% | €98,000 |
| Eure-et-Loir | +3.4% | +3.4% | €150,000 |
| Indre | 0.0% | -4.2% | €80,000 |
| Indre-et-Loire | +5.7% | +4.0% | €180,000 |
| Loir-et-Cher | +7.3% | -3.3% | €118,000 |
| Loiret | +3.3% | +6.9% | €155,000 |
| GRAND EST | |||
| Ardennes | -5.1% | +0.6% | €100,000 |
| Aube | 0.0% | +2.5% | €125,000 |
| Haute-Marne | +1.3% | -16.0% | €76,000 |
| Marne | +0.8% | +0.6% | €163,000 |
| Meurthe-et-Moselle | +5.7% | +3.6% | €156,500 |
| Meuse | -3.6% | +17.9% | €95,000 |
| Moselle | +8.2% | +23.1% | €179,300 |
| Bas-Rhin | -0.1% | +11.2% | €220,600 |
| Haut-Rhin | -1.8% | +11.6% | €206,600 |
| Vosges | -0.8% | -0.8% | €109,100 |
| HAUTS DE FRANCE | |||
| Aisne | -4.9% | +1.0% | €101,000 |
| Nord | +2.0% | +6.3% | €153,000 |
| Oise | +4.3% | +6.7% | €183,500 |
| Pas-de-Calais | +2.2% | +6.2% | €138,000 |
| Somme | +3.9% | +8.3% | €130,000 |
| ILE-DE-FRANCE* | |||
| Paris | +6.6% | N/A | €10,210m2 |
| Seine-Saint-Denis | +4.3% | N/A | €3,640m2 |
| Haute-de-Seine | +5.8% | N/A | €6,090m2 |
| Val-et-Marne | +4.3% | N/A | €4,660m2 |
| Val d'Oise | +2.9% | N/A | €2,760m2 |
| Yvelines | +3.9% | N/A | €3,930m2 |
| Essonne | +2.5% | N/A | €2,670m2 |
| Seine-et-Marne | +2.9% | N/A | €2,680m2 |
| NOUVELLE-AQUITAINE | |||
| Charente | +1.3% | +15.4% | €120,000 |
| Charente-Maritime | +4.9% | +10.7% | €191,000 |
| Corrèze | +11.5% | +7.0% | €107,000 |
| Creuse | -6.6% | -6.8% | €59,700 |
| Deux-Sèvres | +12.5% | +14.3% | €120,000 |
| Dordogne | +3.7% | +10.8% | €121,900 |
| Gironde | +5.9% | +28.8% | €259,800 |
| Landes | +6.0% | +18.9% | €196,100 |
| Lot-et-Garonne | +1.1% | 0.0% | €120,000 |
| Pyrénées-Atlantiques | +3.6% | +8.1% | €216,100 |
| Haute-Vienne | +9.1% | +2.5% | €120,000 |
| Vienne | -0.8% | +4.2% | €125,000 |
| OCCITANIE | |||
| Ariège | 0.0% | +4.2% | €105,500 |
| Aude | -3.0% | -3.7% | €130,000 |
| Aveyron | +11.0% | +3.7% | €111,000 |
| Gard | +1.3% | +8.5% | €199,600 |
| Gers | -9.9% | +10.3% | €128,500 |
| Haute-Garonne | +2.7% | +12.0% | €246,500 |
| Hautes-Pyrénées | +9.9% | +10.8% | €144,000 |
| Hérault | +5.0% | +6.1% | €225,000 |
| Lot | +4.2% | +6.3% | €125,000 |
| Lozère | +12.2% | +12.2% | €110,000 |
| Pyrénées-Orientales | -1.8% | -2.4% | €166,000 |
| Tarn | -2.0% | -0.5% | €137,300 |
| Tarn-et-Garonne | +11.8% | +10.3% | €162,100 |
| NORMANDY | |||
| Calvados | +5.1% | +13.9% | €180,000 |
| Manche | +5.1% | +21.9% | €137,000 |
| Orne | +2.7% | -5.0% | €95,000 |
| Eure | +2.0% | +4.9% | €153,000 |
| Seine-Maritime | +3.0% | +6.2% | €155,000 |
| PAYS DE LA LOIRE | |||
| Loire-Atlantique | +7.1% | +18.4% | €225,000 |
| Maine-et-Loire | +3.8% | +10.0% | €154,000 |
| Mayenne | +6.1% | +20.4% | €116,800 |
| Sarthe | +1.6% | +13.1% | €127,000 |
| Vendée | +5.3% | +15.6% | €165,300 |
| PROVENCE-ALPES-COTE D'AZUR | |||
| Alpes-de-Haute-Provence | +6.8% | +21.9% | €185,000 |
| Alpes-Maritimes | -2.7% | +2.3% | €437,100 |
| Bouches-du-Rhône | +0.2% | +14.3% | €320,000 |
| Hautes-Alpes | +9.6% | +18.3% | €224,800 |
| Var | +5.4% | +6.8% | €325,600 |
| Vaucluse | +5.2% | +3.1% | €226,800 |
Source: Notaires de France
Thank you for showing an interest in our News section.
Our News section is no longer being published although our catalogue of articles remains in place.
If you found our News useful, please have a look at France Insider, our subscription based News service with in-depth analysis, or our authoritative Guides to France.
If you require advice and assistance with the purchase of French property and moving to France, then take a look at the France Insider Property Clinic.